Behind each of the hundreds of nonprofit organizations in the Cape Fear region is a team of dedicated individuals with their own motivations and vision for a better tomorrow that has rallied them to improve their communities. Each of these teams is setting goals and implementing programs while competing for grants and funding.
Imagine how powerful this network could be if they utilized a common platform of vocabulary, data, and insights; a data-driven community with shared understanding and measurement.
Cape Fear Collective (CFC) is a nonprofit in Southeastern North Carolina focused on innovating the social impact sector. Our core data goal is to operate at the intersection of insights and action, creating a platform that allows organizations to develop the data literacy, access, and capability necessary to fuel systemic change. We do this by providing localized, up-to-date data and insights with a focus on the lived experience.
COMMUNITY DATA PLATFORM
Too often in our region, policymakers and program managers are making decisions based on pdf charts that are three or more years old. Or they’re trying to localize national or statewide studies that miss the nuance of their immediate community. While it is certainly true that many issues are universal, local and recent contexts can be informative, empowering, and most importantly, targeted. CFC aims to meet these needs with our Community Data Platform (CDP).
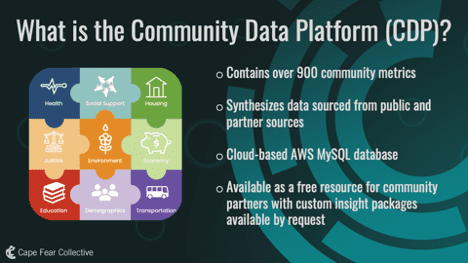
Through thousands of conversations with community partners and research experts, we identified nine categories that comprise the puzzle of community well-being: Health, social support, housing, justice, environment, economy, education, demographics, and transportation. The CDP provides granular, up-to-date, multi-dimensional data on each of these puzzle pieces, all publicly available and in one place.
Several national data sources are popular choices for data analysts because of their reliability. The Census Bureau, for example, approaches data collection, analysis, and storage with rigorous process and documentation. Several universities and government entities provide public access to data through download or API access.

Accessing, cleaning, and compiling these various data sources, however, can be an overwhelming and costly process; many organizations do not have the funding needed to bring this capability to their team.
CFC’s CDP incorporates as much of these publicly available data as possible, while also bolstering the pool through local data usage agreements. For example, by combining unemployment data from the Bureau of Labor Statistics with data collected from local organizations focused on workforce development, our community can analyze the state of the job market at a previously unattainable level of granularity.
Additionally, the CDP can be used to incorporate multi-dimensional metrics to examine the issue of economic opportunity from many angles—applying the lenses of education, housing, transportation, and inclusivity.
This democratization of data is changing the way nonprofits are operating in our region. By providing cleaned versions of these data sets, along with curated visualizations and insights, we remove the technological barrier for community leaders, magnifying their ability to inform programming, conduct advocacy, and support fundraising efforts.
THE LIVED EXPERIENCE
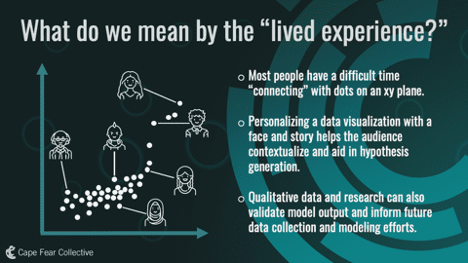
Like computers, we process the world through our own unique neural networks. We have hidden layers that shape the way we see the world. But unlike computers, we were not designed to digest data. We have a strong urge to make sense of the world through stories, not numbers. But we can leverage our humanity by sharing the lived experiences of others and amplifying the voices behind the data—remembering that every data point we analyze is a person.
It is impossible to be a data-driven organization without qualitative data—the stories that numbers alone cannot capture. Conversely, the same individual context that makes us human can result in bias when information is processed through an individual lens, making it possible for one story to supersede overwhelming data to the contrary. Alone, neither qualitative nor quantitative data can tell the entire story. Together, however, they become a powerful force for change.

“But we can leverage our humanity by sharing the lived experiences of others and amplifying the voices behind the data—remembering that every data point we analyze is a person.”
COMMUNITY HEALTH DASHBOARD
The CDP is anchored around the Healthy NC 2030 Initiative. Led by the North Carolina Institute of Medicine and the North Carolina Department of Health and Human Services, this report brought together experts from multiple fields to identify 21 public health targets for the State over the next decade. While never meant to be an exhaustive list, these metrics represent a starting point of high-priority issues for the State. However, it can be difficult for local decision-makers to understand how their work contributes to North Carolina reaching its ten-year goals.
To assist our community partners in the transition to data-driven goals, we are constructing a Community Health Dashboard (scheduled for release in August 2021) which localizes these targets at the census tract level, informs the user of leading and correlated indicators, and utilizes predictive analytics to forecast the current trends into 2030 and beyond.

Through our community engagement and media partnerships, we seek to amplify the experiences of those who have typically been excluded from the conversation. This is not done to validate their experience. Rather, this qualitative dimension allows others in the community an opportunity to contextualize the data in a different, more meaningful way. It closes the gap between ourselves and “the other,” creating common ground for analysis, contemplation, and accountability. Additionally, these conversations inform future data collection efforts and analyses.
This ideology does not pertain solely to our podcasts and interviews, but also to the very nature of our work. Every board, task force, committee, and meeting we participate in must incorporate the lived experience, either through direct representation or the inclusion of qualitative data or primary research in some way.
Consider, for example, Healthy NC 2030 Indicator 9: Severe housing problems. According to the report, 16.1% of North Carolina households met at least one of the following criteria: Overcrowded, cost-burdened, or having inadequate plumbing or kitchen facilities. The 2030 target set for this metric is 14%, however, New Hanover County is already well above that (19% of households). Even within New Hanover County, there is considerable variability – some census tracts are as low as 5% while census tract 108 has 39.7% of households meeting the criteria for severe housing problems. Understanding that distribution, rather than focusing on the statewide value, allows for resource allocation and targeted intervention. Further, the Healthy NC 2030 report does not report race and ethnicity disaggregation for this metric, a level of granularity capable of being extracted from the CDP.
“Data can be a powerful tool; an illuminator of disparity and a call to action.”
Of course, understanding the current snapshot of severe housing problems is only one piece of the puzzle. By applying predictive modeling techniques to the multi-dimensional CDP, the Community Health Dashboard provides insight into several forward-looking data questions. In order to successfully implement targeted programming, the community must understand how these metrics are trending, whether they are predicted to continue on that track, and what other metrics are correlated.
Finally, an accurate, up-to-date, and actionable data story on severe housing problems can serve as a rallying point for community members and support organizations. Those on the frontlines are best suited to recommend interventions and, armed with this granular data, can scale their existing programming and ideate new tools that will decrease disparities and promote equity. Community convening on these metrics will help to develop leading indicators and near-term to long-term goal setting for anchor organizations and smaller grassroots organizations alike. By aligning the work of hospitals, school districts, nonprofits, advocates, and the faith-based community in a community-driven way, we can build a better system to support our neighbors achieve health, education, and economic prosperity.
Data can be a powerful tool; an illuminator of disparity and a call to action.
Access to predictive insights has traditionally been a barrier, both for the community and the organizations working to make it better. Even less common is a community working to turn those insights into action and accountability. Through our focus on shared data and measurement, the lived experience, and data science, and under the vision and leadership of our community partners, we believe we can shape the future of the Cape Fear region.


